↑
Electricity Rates Keep Rising
ComEd rates are up +90% in 5 years and projected to keep climbing. A solar lease gives you a rate as low as $0.10/kWh, predictable for 25 years.

ComEd rates are up +90% in 5 years. Compare $0 down lease, cash, and Solar for All options for your home.
With $0 down, no maintenance costs, and immediate savings on your ComEd bill, a solar lease is the easiest way to cut your electricity costs. Our trusted installer partners offer 25-year lease terms with battery storage included — all while ComEd rates keep climbing.
No upfront cost to compare lease options for your home.
Compare a predictable solar payment against your current and projected ComEd bill.
Keep the lights on during outages with included battery storage.
Your installer handles all repairs and monitoring for the life of the lease.
Prefer to own your system? We also offer cash purchase and financing options. Contact us to compare all options.
Orangeville, a community of 917 residents, features a median income of 63,690 and a strong homeownership rate of 76.2%. The housing market is characterized by single-family homes with a median value of 136,100, reflecting its rural, small-town setting in Stephenson County. The local workforce likely supports regional agriculture and small businesses within the area.
Homeowners in Orangeville are paying more for electricity than ever. ComEd rates have surged and are projected to keep climbing. A $0 down solar lease can trade utility volatility for a predictable solar payment, while cash purchase and financing options are available for homeowners who prefer ownership.
With 3.9 peak sun hours daily, Orangeville offers a solid foundation for solar energy production. Seasonal variations, including cold winters and hot summers typical of Illinois, influence system output. The rural landscape often provides ample roof space and minimal shading from dense urban structures, enhancing suitability for residential installations.
The local figures behind every estimate on this page: who owns homes in Orangeville, how much sun those roofs get, and what a typical system here produces.
Sources: U.S. Census Bureau ACS 5-Year (2022), Google Solar API building insights, Google Geocoding. Production and savings figures are estimates.
High homeownership (76.2%) and a prevalence of single-family homes in Orangeville present favorable conditions for residential solar adoption. The community's small-town character suggests properties often have good roof exposure and sufficient space for potential system placement.
ComEd rates are up +90% in 5 years and projected to keep climbing. A solar lease gives you a rate as low as $0.10/kWh, predictable for 25 years.
Illinois Shines RECs, $300/kW DG rebate, and 100% property tax exemption offset the expired federal ITC.
Orangeville gets enough sun to power most homes. Modern panels work great even on cloudy days.
Solar adds value to your home — and Illinois exempts 100% of that value from property taxes.
Stop being at the mercy of utility rate hikes. Own your power and control your energy costs.
Current ComEd Rate
17.07¢
per kWh
ComEd residential electricity rates have increased +90% over the past 5 years, from 9¢/kWh to 17.07¢/kWh. That's nearly double what Orangeville homeowners were paying just a few years ago.
Rates are projected to reach 19¢/kWh next year. PJM 2027-28 auction: $333.44/MW-day (new record, hit FERC price cap, still left 6,623 MW reliability shortfall). Northern IL faces capacity shortfalls by 2029.
A solar lease gives you a rate as low as 10¢/kWh, predictable for 25 years — the full schedule is set in your contract. After that, keep the system for a low buyout and pay $0/mo. Meanwhile, ComEd rates keep climbing.
Even without the federal tax credit, Illinois homeowners have access to some of the best solar incentives in the country.
~$7,783*
First 50% paid about 12–14 months after installation, the rest in quarterly payments over 6 years. REC values went up for the new program year. Cash/finance buyers receive directly; lease customers benefit through lower payments.
Eligibility: Residential systems under 25 kW in ComEd territory
$300/kW
$300 per kW rebate from your utility. Average system in Orangeville is ~7.5 kW (~$2,250 est.).
Eligibility: All IL residential solar with Ameren/ComEd
100%
Your home value increases but property taxes stay the same. Permanent exemption, no sunset date.
Eligibility: All IL residential solar installations
No Solar Payments
Official state program for income-eligible households. No solar payments, no upfront costs, no credit check. Guaranteed savings on your electricity bill. Own your system after 6 years.
Eligibility: Household income at or below 80% Area Median Income (AMI)
Bill Credits
Excess solar energy sent back to the grid earns a bill credit for the supply portion of your rate. Credits carry forward to later bills.
Eligibility: All new solar installations
Total Estimated Incentive Value
~$10,033+*
Estimates based on average home in Orangeville. Your actual costs and savings depend on your roof, shading, and usage. Get a free custom quote.
25-Year Solar Lease + Battery
~$116/mo
$0 down — start saving from day one
~707 kWh/mo × $0.10/kWh (est.)
Included on all 25-year leases
Cash / Finance Purchase
$9,467
True cost after all incentives
After ~6.3 years breakeven, it's pure profit and inflation protection for the remaining 20+ years. Panels are expected to last 25 to 35 years.
All figures are estimates based on area averages. Your actual savings will be calculated during a free consultation based on your specific home, roof, and energy usage.
Estimated 25-Year Total Savings
$46,377
| Year | Without Solar | With Solar | Cumulative Savings |
|---|---|---|---|
| Year 1Profit Starts | $1,644 | $1,598 | $46 |
| Year 2 | $3,387 | -$676 | $4,062 |
| Year 3 | $5,234 | $315 | $4,919 |
| Year 4 | $7,192 | $1,328 | $5,864 |
| Year 5 | $9,267 | $2,366 | $6,901 |
| Year 6 | $11,467 | $3,432 | $8,036 |
| Year 7 | $13,799 | $4,526 | $9,274 |
| Year 8 | $16,271 | $5,651 | $10,621 |
| Year 9 | $18,892 | $7,458 | $11,433 |
| Year 10 | $21,669 | $9,302 | $12,367 |
| Year 11 | $24,613 | $11,185 | $13,428 |
| Year 12 | $27,734 | $13,110 | $14,624 |
| Year 13 | $31,042 | $15,081 | $15,962 |
| Year 14 | $34,549 | $17,100 | $17,449 |
| Year 15 | $38,266 | $19,172 | $19,094 |
| Year 16 | $42,206 | $21,301 | $20,905 |
| Year 17 | $46,382 | $23,490 | $22,892 |
| Year 18 | $50,809 | $25,745 | $25,064 |
| Year 19 | $55,501 | $28,070 | $27,432 |
| Year 20 | $60,476 | $30,471 | $30,005 |
| Year 21 | $65,748 | $32,953 | $32,795 |
| Year 22 | $71,337 | $35,522 | $35,815 |
| Year 23 | $77,261 | $38,185 | $39,076 |
| Year 24 | $83,541 | $40,949 | $42,592 |
| Year 25 | $90,197 | $43,820 | $46,377 |
We analyze your ComEd bill, roof, and energy usage to design the optimal system for your home.
You get a detailed proposal with estimated costs, savings, incentives, and financing options — no surprises.
We handle all permits, utility paperwork, and ComEd interconnection — you don't lift a finger.
Our certified installers complete the installation in 1-2 days. Quality equipment with 25-year warranties.
Your system goes live, monitoring starts, and your actual bill can be compared against the proposal projections.
Not stock photos. These are homes we helped go solar.


“41 panels, $10/month electric bills. Ryan stayed on top of the project from start to finish.”
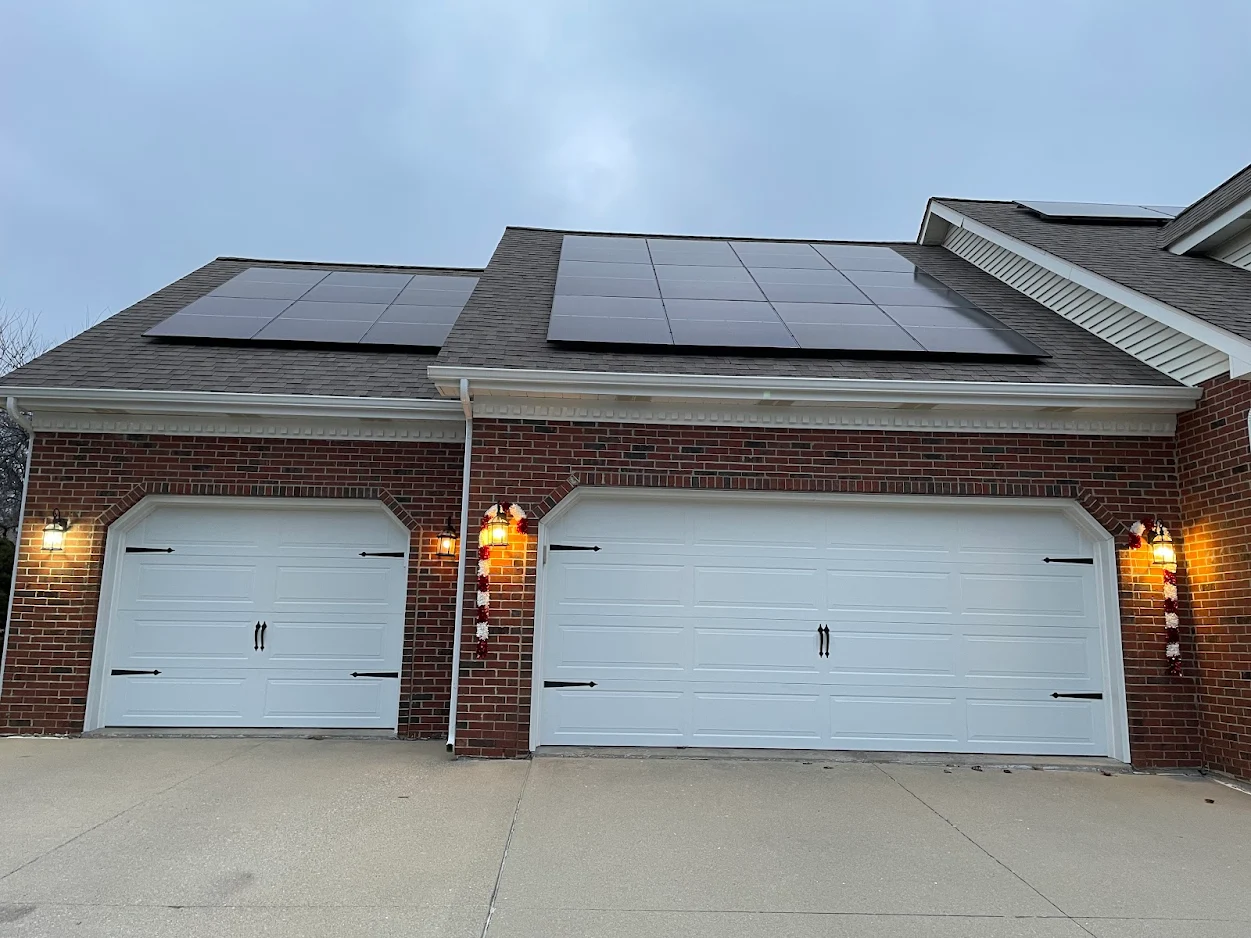
“$10/month Ameren bills since June 2023. Outstanding knowledge and responsiveness.”
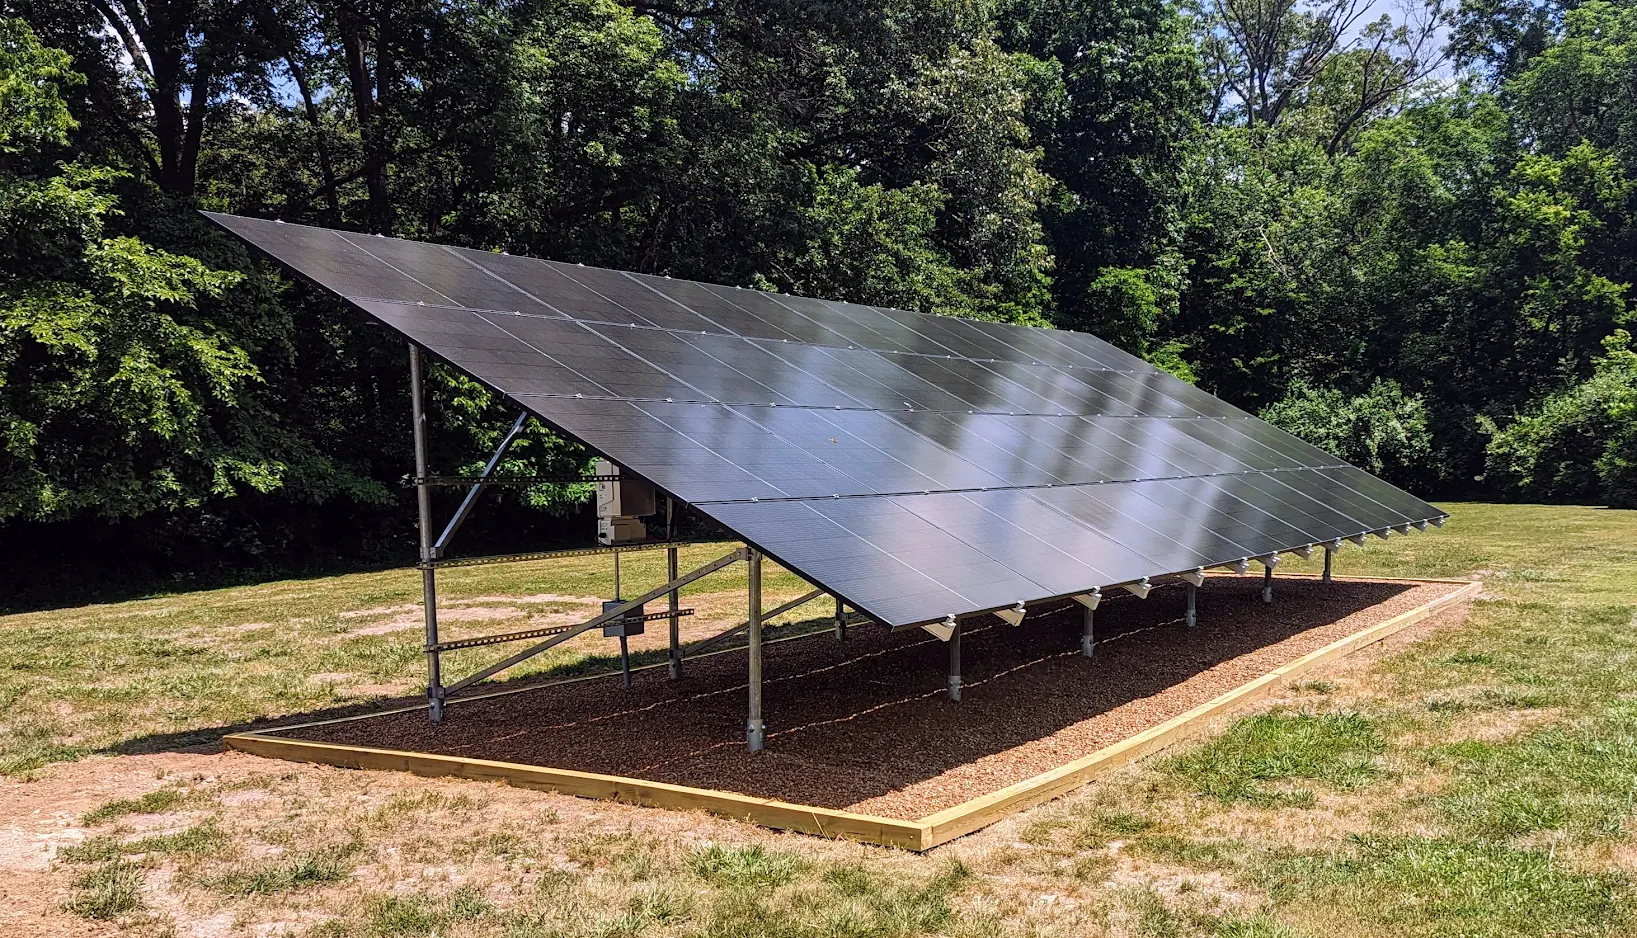
“Ryan is knowledgeable, caring, and a really good listener. I highly recommend discussing solar with him.”
Evaluate your property for potential tree shading, especially in rural areas where mature trees might significantly impact roof exposure during peak sun hours.
Consider the age and condition of your roof before installation to avoid future disruptions and ensure long-term stability for the solar energy system.
Assess lot size and orientation; larger properties might offer ground-mount options if roof space is limited or significantly shaded.
Upload a photo of your house and our AI will show you what solar panels would look like — instantly.
Ready to talk? Call Ryan directly:
(618) 217-2001Detailed year-by-year savings breakdown
All available solar incentives
ComEd rate history & projections
Local solar numbers depend on your utility, Illinois incentive rules, and state program eligibility.
We provide solar consulting to homeowners throughout Illinois
See if your Orangeville home qualifies for a $0 down solar lease. No obligation, no pressure — just real numbers for your situation.
✓ Lease, cash, or Solar for All — we find the best option for your home
ComEd rates are projected to rise again. Waiting means more months exposed to utility increases.
Enter your address to see if your roof is a good fit for solar. Uses Google's satellite imagery and AI analysis.
This is an estimate based on satellite imagery. A free on-site assessment will provide more accurate numbers for your home.
Take a photo or choose from your library
Photos up to 10 MB • we'll compress automatically