Illinois' First Statewide Power Plan Models Electric Rates Near 23¢ by 2030 and Up to 40¢ by 2047
Illinois' own energy agencies now model the average home electric rate at about 23¢ per kWh by 2030 for both ComEd and Ameren Illinois customers, and between 33¢ and 40¢ by 2047. Those numbers come from the state's first Integrated Resource Plan, which the Illinois Commerce Commission issued on November 16, 2026. The same chart puts 2025 at 17.7¢ for ComEd and 16.7¢ for Ameren.
These are illustrative, scenario-based figures. They aren't a rate order, and the report says so. But this is the first time the state has put its own long-range price path for household electricity on paper, and it's worth ten minutes of your time if you pay a power bill here.
Key facts: what the plan models for home electric rates
All figures are the plan's Reference Case, in nominal cents per kWh (the dollars of each year), and they bundle supply, delivery, transmission and program charges.
| Year | ComEd residential | Ameren Illinois residential |
|---|---|---|
| 2025 (starting point) | 17.7¢ | 16.7¢ |
| 2030 | 23.1¢ | 23.0¢ |
| 2035 | 31.5¢ | 30.0¢ |
| 2040 | 32.6¢ | 28.8¢ |
| 2045 | 38.9¢ | 31.5¢ |
| 2047 | 39.9¢ | 32.7¢ |
Source: Integrated Resource Plan, Chapter 8, Figure 8-19, issued November 16, 2026.
| Other facts | Figure |
|---|---|
| Report issued | November 16, 2026 |
| ICC review case expected to begin | November 19, 2026 |
| ICC decision | Expected by November 2027 |
| Planning horizon | Through 2047, 22 modeled cases |
| Total modeled system cost, Reference Case | About $278 billion (net present value, 2030–2047) |
| PJM capacity gap (whole PJM region) | 12 GW in 2026, growing to 34 GW in 2030 |
| Ameren zone (MISO Zone 4), 2030 | 3.91 GW shortfall without out-of-state capacity |
| Data center share of ComEd zone energy by 2050 | About one-third (roughly 54 of 154 TWh) |
| Data center share of Ameren zone energy by 2050 | Nearly half (roughly 44 of 90 TWh) |
What that means on a bill
Here's the simple version, and it's my arithmetic, not the state's. Take a home that uses 1,000 kWh in a month.
- ComEd: about $177 at the 2025 rate, about $231 at the 2030 rate, about $399 at the 2047 rate.
- Ameren Illinois: about $167, then about $230, then about $327.
That's a 31% jump for ComEd and a 38% jump for Ameren between 2025 and 2030. The steepest stretch is the next nine years. By 2035 the modeled rate is 31.5¢ for ComEd and 30.0¢ for Ameren, close to 80% above the 2025 starting point in both territories.
I want to be fair about inflation, because these are nominal numbers. If prices in general rose 2.5% a year (my assumption, not the plan's), a 17.7¢ rate would drift to about 20¢ by 2030 and about 30.5¢ by 2047 without anything else going on. The plan's ComEd path is 23.1¢ and 39.9¢. So the state is modeling electricity that runs well ahead of ordinary inflation, with most of the damage arriving early.
Why the numbers climb
The plan gives two "foundational takeaways." The first is that Illinois faces a supply squeeze that reflects regional and national trends, "driven primarily by data center load growth," with new capacity failing to keep pace with both plant retirements and demand.
The grid numbers back that up. For PJM, the regional grid ComEd sits in, the plan projects a capacity need of 12 GW beyond what's available in 2026, growing to 34 GW by 2030. In Ameren's zone, last year's state study showed a 0.31 GW surplus for 2030. This year's update shows a 3.91 GW shortfall once out-of-state capacity is set aside. The report is careful here: a projected need isn't a prediction of blackouts. It means more has to get built, or demand has to come down. I covered the reliability side in Will Illinois Have Rolling Blackouts?
Then there's who pays. The plan explains that homes pick up a bigger slice of capacity costs because households use a large share of power at peak. In the ComEd zone, the average cost across all customer classes goes from 9.9¢ per kWh in 2030 to 16.4¢ in 2047. The residential supply cost goes from 11.9¢ to 22.4¢. Add delivery (9.9¢ rising to 14.7¢), transmission service (0.3¢ rising to 1.7¢), and program costs (0.9¢ rising to 1.1¢), and you land at roughly 23¢ and 40¢.
If you've watched the last five years, none of this feels new. I laid out that history in ComEd and Ameren Rate Increases, 2021 to 2027, and the data center piece in ComEd's Data Center Cost Gap. What's new is the state saying it in its own planning document.
The cheaper scenarios, and what they'd take
The Reference Case isn't the only path the plan ran. Four other cases got the same rate treatment, and every one of them still ends well above today.
| Scenario | ComEd 2047 | Ameren 2047 |
|---|---|---|
| Reference Case | 39.9¢ | 32.7¢ |
| Data centers cut demand in the 100 highest-load hours each year | 38.2¢ | 31.4¢ |
| 100% clean-power standard that also counts nuclear | 36.3¢ | 32.1¢ |
| Existing gas and coal plants kept past their retirement dates | 34.5¢ | 31.0¢ |
| High electrification with flexible demand | 31.2¢ | 31.4¢ |
Source: Integrated Resource Plan, Chapter 8, Sections 8.3.1, 8.3.5, 8.3.6, 8.4.1 and 8.4.5.
Two things stand out to me. Making data centers flex during just 100 hours a year cuts total modeled system costs by about $22 billion, or 8%. That's a lot of money for a small ask. And the lowest 2047 number on the table, 31.2¢ for ComEd, is still 76% above the 2025 starting point.
My take: the debate in Springfield over the next year is about whether your rate lands in the low 30s or near 40. None of the five scenarios the plan ran rates for brings it back to the teens.
What the plan says about rooftop solar and batteries
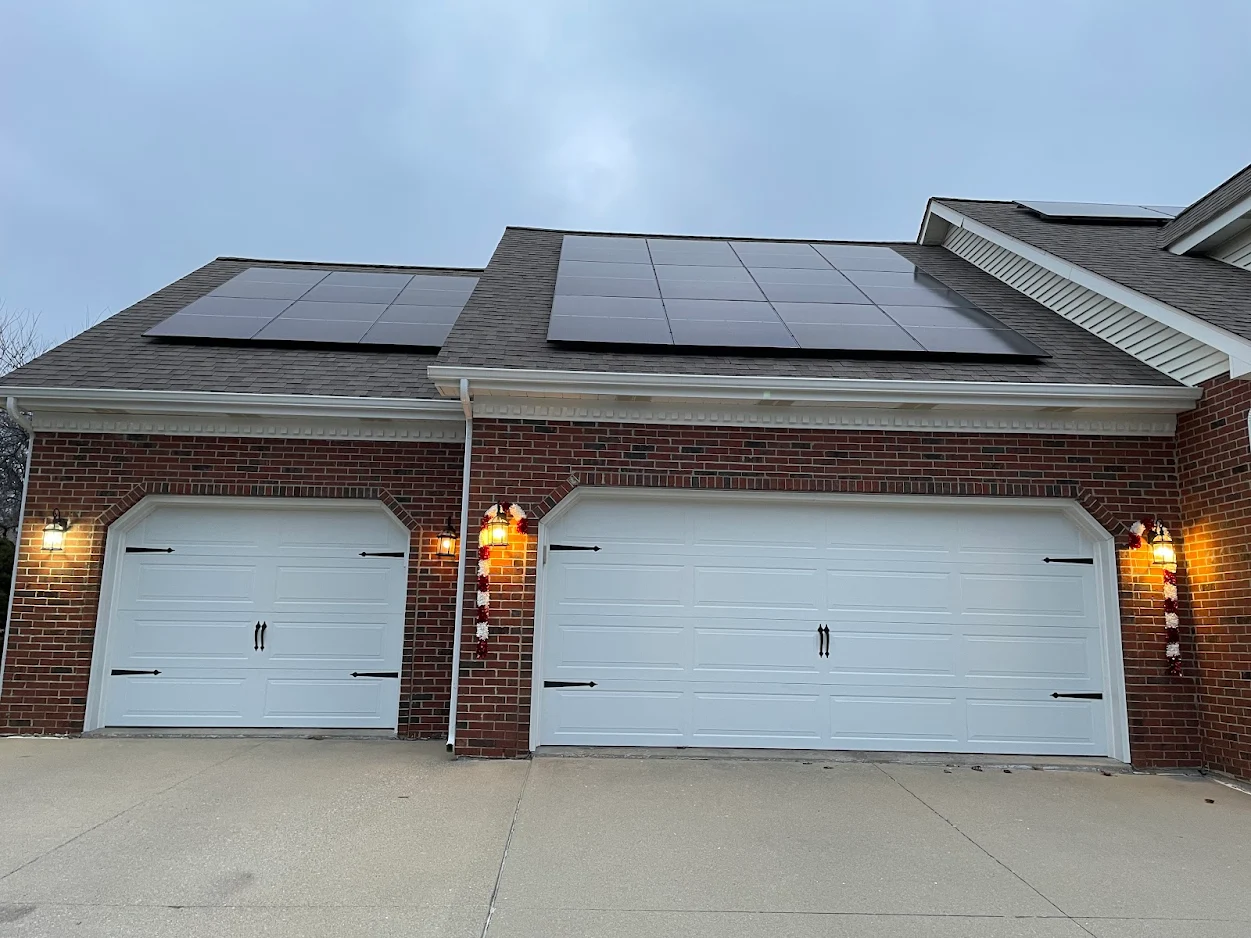
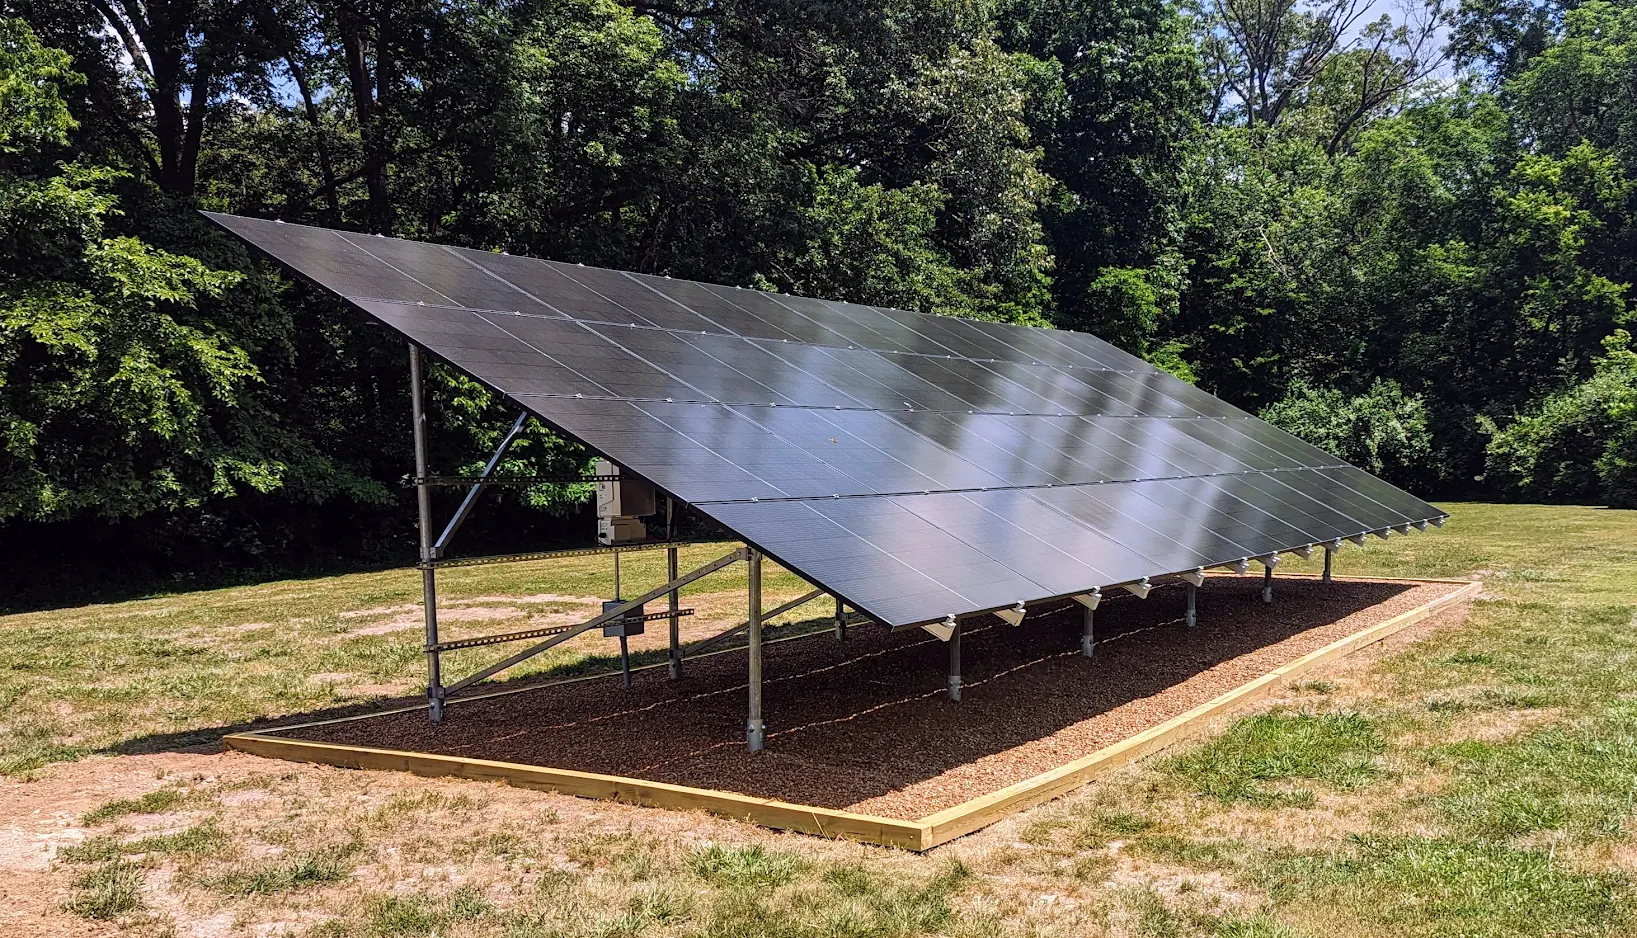
Rooftop solar isn't a side note in this document. The modeling assumes distributed solar keeps growing under existing state programs: 6.5 GW in ComEd territory and 2.8 GW in Ameren territory by 2030, reaching 9.9 GW and 4.6 GW by 2050.
The findings chapter goes a step further. It says distributed solar "can often be deployed more quickly than the utility-scale resources selected by the model," so more of it may help with near-term supply while slower projects get built. The topics teed up for the ICC case include policies to maximize cost-effective virtual power plants and distributed generation "such as rooftop and community solar," and exploring new or expanded solar-plus-storage programs.
That's not a new incentive. It's direction. But it lines up with what's already happening, like the virtual power plant commitment tied to the $300-per-kWh home battery rebate. The state needs capacity fast, and a battery in a garage shows up years sooner than a nuclear plant.
What happens next
The report starts a process. The Illinois Power Agency's page says the docketed review at the ICC is expected to begin November 19, 2026. The ICC has 180 days to approve the plan or approve it with changes, and can extend by up to another 180. The Commission's own page says a decision is expected by November 2027. The agencies will file specific recommendations as testimony in that case, so the real policy fights are still ahead. The second plan is due September 30, 2029.
Nothing in this plan changes your bill this winter. Your actual rate still comes from the yearly supply price reset and delivery rate cases. For where those stand now, see our ComEd rates and Ameren rates pages.
What I'd do with this
I sell solar, so weigh this accordingly. I think the honest read is simple: the people responsible for planning Illinois' grid just told you they expect power to cost a lot more, and that the sharpest climb comes between now and 2035.
You can't control a capacity auction. You can control how much of your power you buy from the utility at whatever the rate turns out to be. With a solar lease, it's $0 down, a battery is included, and your full 25-year rate schedule is set in your contract before you sign, so there are no surprises. Rates start as low as $0.10/kWh. Some homeowners would rather buy with cash and own the system outright. Income-qualified households may fit Illinois Solar for All. We'll show you all three.
It doesn't pencil for every roof, and I'll tell you if yours is one of them. If you'd like to see your own numbers against the state's price path, try the savings calculator, call me at (618) 217-2001, or send a note. Savings figures are estimates and depend on your home, your usage and your utility.
Sources
- Illinois Commerce Commission, Integrated Resource Plan page (report issued November 16, 2026; decision expected by November 2027): https://icc.illinois.gov/informal-processes/Integrated-Resource-Plan
- Integrated Resource Plan, Executive Summary (November 16, 2026): https://icc.illinois.gov/downloads/public/IRP/Executive_Summary.pdf
- Integrated Resource Plan, Chapter 1, Introduction (ICC review timeline): https://icc.illinois.gov/downloads/public/IRP/Chapter_1_Introduction.pdf
- Integrated Resource Plan, Chapter 5, Approach and Methodology (how the rate estimates are built and their limits): https://icc.illinois.gov/downloads/public/IRP/Chapter_5_IRP_Approach_and_Methodology.pdf
- Integrated Resource Plan, Chapter 6, Baseline Assumptions (distributed solar and data center load): https://icc.illinois.gov/downloads/public/IRP/Chapter_6_Baseline_Assumptions.pdf
- Integrated Resource Plan, Chapter 7, Reliability Needs (PJM and MISO Zone 4 capacity balances): https://icc.illinois.gov/downloads/public/IRP/Chapter_7_Reliability_Needs.pdf
- Integrated Resource Plan, Chapter 8, Long-Term Resource Planning (Figure 8-19 and scenario rates): https://icc.illinois.gov/downloads/public/IRP/Chapter_8_Long-Term%20Resource%20Planning.pdf
- Integrated Resource Plan, Chapter 9, Findings and Recommendations (distributed solar, virtual power plants): https://icc.illinois.gov/downloads/public/IRP/Chapter_9_Findings_and_Recommendations.pdf
- Illinois Power Agency, IRP information page (review case expected to begin November 19, 2026): https://ipa.illinois.gov/electricity-procurement/ra-planning/irp-info.html